The Future of Reporting is here.
Unity5 is proud to have launched new-look dynamic reporting dashboards for Zatpark. As of 4th August Zatpark users can easily build their own visual reporting dashboards and access their most important data and see the latest trends.
Drag & Drop functionality is now available to you…
Your new ‘Daily Dashboard’
This truly dynamic display means that multiple reports can be easily combined to form a ‘daily dashboard’, offering an overview that is unrivalled in the market, revealing trends that can be used to make future data-driven decisions.
Once Advanced Dashboards are initially set up, they offer a future-proof and repeating visual snapshot of the status of the user’s business or enforcement ecosystem.
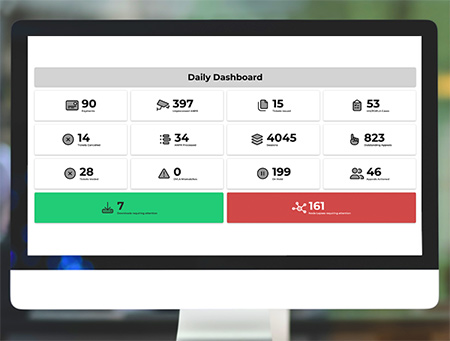
(An example of the new ‘Daily Dashboard’ for Zatpark)
The innovative new tool allows Zatpark customers to:

Build multiple visual dashboards
Quickly see your Performance Indicators (PIs) such as tickets issued per site, per day, or payments received by week.

Display data from your custom queries
View reports from your custom queries as a single value, a count of values, or a data table.

Display counts of system functions
Use system components to see system functions like downloads, node lapses or on-hold tickets.
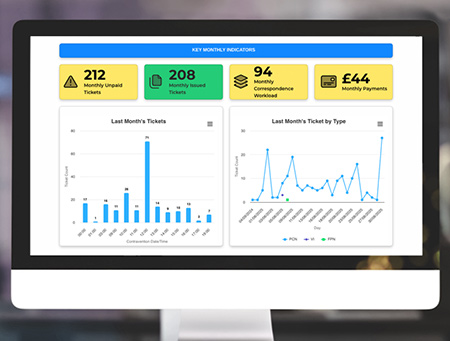
(Multiple reports can be displayed in a single configurable dashboard)
James Hampton, Unity5 Product Manager said:
“The new addition is a game-changer for our users. Customers can quickly see their Performance Indicators (PIs) and can choose to add KPIs, such as tickets issued per site, per day, or payments received by week, saving customers time and creating efficiencies”.
Need a demonstration?
Click here to access our Helpdesk article to learn more and watch a video demo by Unity5 Solutions Consultant Jack Fear.
(Login to Zatpark is required)
New to Unity5?
For sales enquiries please click here
Marketing Manager